Ongoing Planning provides you with confidence and reassurance that you are optimizing relevant planning opportunities and have a professional watching over your “stuff”. You get the benefit of having on-demand meetings or calls for urgent life planning matters as well as unlimited phone and email support.

 A wealth of information at your fingertips.
3 Things: Vacation Mode
August 15, 2018
in SAGE Reads
Vacation Mode: The band is back together this week (all four of us are in the same house at the same time!) so I’m taking some vacation days. Here are some interesting, non-financial pieces to enjoy while I’m away.
1. People hearing sounds for the first time reminds us that science can be a wonder
The beauty of science is profoundly real when you see the first expressions of people hearing sounds...
3 Things: Wealth Scale, the Generations, & People in the Wild
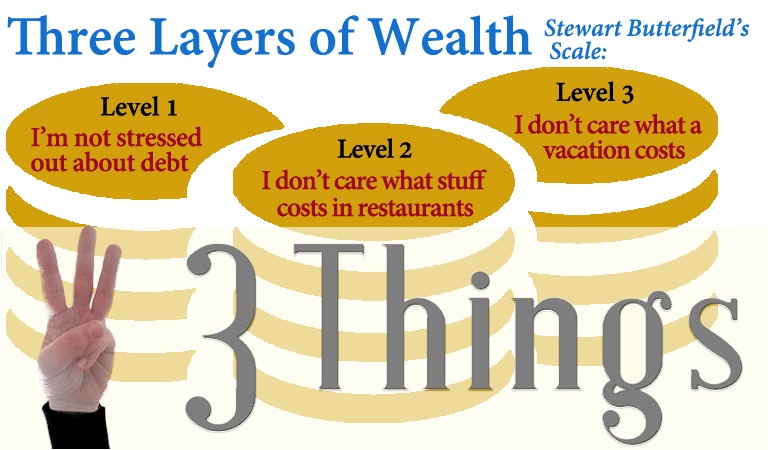
Where are you on this scale? 1. In “The Three Levels of Wealth,” Ben Carlson tries to determine where most Americans might find themselves on Stewart Butterfield’s scale: Level 1. I’m not stressed out about debt: People who no longer have to worry about their credit card debt or student loans. Level 2. I don’t care what stuff costs in restaurants: How much you spend on a particular meal isn’t impacted by your finances. Level 3. I don’t care...Dimensional Fund Advisors: What You Pay, What You Get: Connecting Price and Expected Returns
What’s That Stock Worth to You? They say your home is your castle, but that doesn’t mean you should have to pay lavish prices to live there – at least no more than the going rate for a similar estate. It’s the same for your investments. You expect to pay something for the holdings in your portfolio, but there’s no sense paying more than market rates. If you do, it counts directly against the...Dimensional Fund Advisors: The Tao of Wealth Management
July 2018 The Tao of Wealth Management The path to success in many areas of life is paved with continual hard work, intense activity, and a day-to-day focus on results. However, for many investors who adopt this approach to managing their wealth, that can be turned upside down. The Chinese philosophy of Taoism has a phrase for this: “wei wu-wei.” In English, this translates as “do without doing.” It means that in some...3 Things: Bull Markets, Investing Internationally, and Summer Jobs
No, we are not in a 9-year-old bull market 1. Currently some clients, and pundits, are voicing concerns about the longevity of the current bull market. In the September 2017 article “No, This Is Not the Second Longest Bull Market Ever”, Barry Ritholtz and Michael Batnick laid out the case that the period running from mid-2015 to early 2016 "absolutely was a bear market." Barry also explains how he measures...Dimensional’s Quarterly Market Review (Q2 2018)
What’s your favorite mixed nut? In a bowl of mixed nuts, which flavor do you favor? For the record, I’m a sucker for the cashews. It’s fine to pick out your treat preferences. In the market, you’re best off skipping the picking, and sticking instead with an appropriately balanced mixed bag. This quarter’s up-and-down returns continue to show us why. Whether we view the market by quarter, year or more, we’ll always see...3 Things: Taxes, Taxes & More Taxes
July 3, 2018
in Tax Management
Have you heard about that new Postcard-sized Tax Return?
Kelly Phillips Erb, aka @taxgirl, gives us a first look in Here's How The New Postcard-Sized 1040 Differs From Your Current Tax Return. Yes, the new 1040 is smaller but it comes with at least six additional schedules, or forms, that many taxpayers will have to attach to the main form. And the font size is TINY.
Does Your State Rely...
 Secure Document Sharing


