A "stunning" chart on inflation Barry Ritholtz shares a chart showing Inflation: Price Changes 1997 to 2017 What do you notice about the cost of college as well as health care? “Wages have barely ticked over the median inflation measure, but that did not stop some people from blaming the correction on rising wages.” Chart Source: Chart of the day (century?): Price changes 1997 to 2017 (AEIdeas, Mark J. Perry, 2/2/2018) 90-second fact-checking what you...

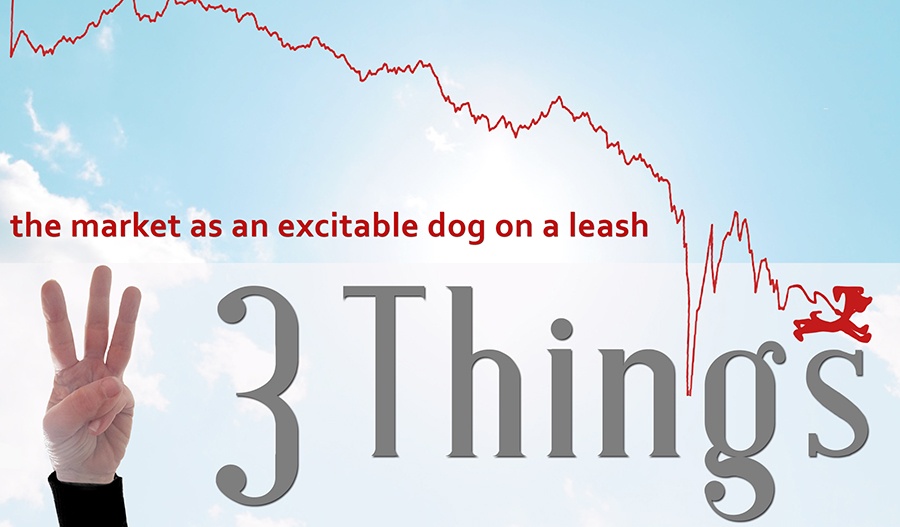
The market as an excitable dog on a leash 1.  One of my favorite financial bloggers, Ben Carlson, writes in Market Earthquakes: “Ralph Wanger, the eccentric portfolio manager of the Acorn Fund, once summed up the stock market to Bill Bernstein with an analogy about walking a dog: He likens the market to an excitable dog on a very long leash in New York City, darting randomly in every direction. The dog’s owner...

Recent Market Volatility February 2018 "While it may be difficult to remain calm during a substantial market decline, it is important to remember that volatility is a normal part of investing" After a period of relative calm in the markets, in recent days the increase in volatility in the stock market has resulted in renewed anxiety for many investors. From February 1–5, the US market (as measured by the Russell 3000 Index) fell...

February 2018 New Year, New Market Highs Every day stocks have a positive expected return regardless of whether markets are at an all‑time high or not. Throughout 2017, the S&P 500 Index recorded 62 new closing highs in 251 days of trading. In the first three weeks of January 2018 alone, the index crossed 10 new record closing highs in 13 days of trading. With stock indices continuing to set new highs, does...

January 2018 Nine Experts, Four Surprises, and One Million Dollar Bet In 2017, we were again reminded of the importance of following an investment approach based on discipline and diversification vs. prediction and timing. As we gear up for the new year, we can look at several examples during 2017 that provide perspective on what guidance investors may want to follow, or not follow, in order to achieve the long-term return the...

One Last Look at the 2017 Bond & Stock Markets Before we proceed full tilt into 2018, let’s take one last look at last year’s heady, mostly double-digit 2017 stock market returns, as shared in Dimensional Fund Advisor’s 2017 Market Review. How best to view the largely fair-weather market performances of late? Your investment experience is like a cross-continental trek. You get to define your desired destination – although, as in real...

Hunches, Headlines and Indicators - 2017 Market Performance It’s a wrap! 2017 market performance numbers are now available for the fourth quarter and the year. And, wow, what a year it was. The Wall Street Journal called it “The Year Everything Went Up.” In a Bloomberg column, Barry Ritholtz declared it “A Very Weird Year in Markets.” The New York Times reflected on how wrong most expert predictions were – as...

OCTOBER  2017 The Uncommon Average “I have found that the importance of having an investment philosophy—one that is robust and that you can stick with— cannot be overstated.” —David Booth The US stock market has delivered an average annual return of around 10% since 1926.[1] But short-term results may vary, and in any given period stock returns can be positive, negative, or flat. When setting expectations, it’s helpful to see the range of...

SEPTEMBER 2017 Lessons for the Next Crisis  We recently experienced the 10-year anniversary of when, in early October 2007, the S&P 500 Index hit what was its highest point before losing more than half its value over the next year and a half during the global financial crisis. Over the coming weeks and months, as other anniversaries of major crisis-related events pass (for example, 10 years since the bank run on Northern Rock...