Dimensional’s Quarterly Market Review (Q1 2018)
A Quarterly Tale of Risks and Returns in Real Time
 For the first time in a long time, U.S. and international developed stock markets alike bled off some steam this quarter. You’ll see that expressed by the bright red arrows in Dimensional Fund Advisors’ first quarter Quarterly Market Review Market Summary (page 3).
While we fully expect markets will continue delivering positive long-term returns, who knows what the rest of the year has in store? It could be a bumpy ride! If your investment plan is already in place, it likely remains your best course forward. If it’s up in the air, think of the jolt as a reminder to take a seat and get planning.
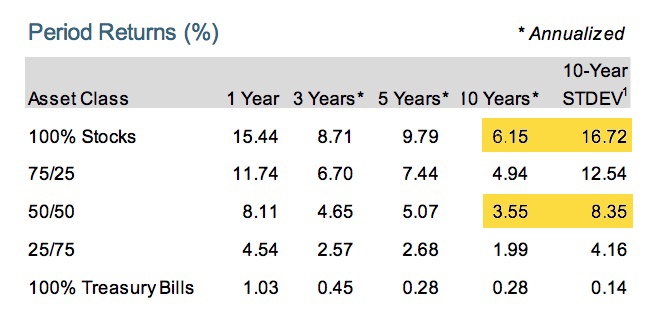
Either way, among the biggest decision points in your investment plan is your stock/bond mix, i.e., your exposure to the stock market’s extra risks and expected returns. Consider the final two columns in the “Impact of Diversification” table on page 15 (excerpted here).
Impact of Diversification

In the final column, “STDEV” stands for “standard deviation,” which is financial talk for how wild a ride you must expect in pursuit of long-term returns. To earn the 10-year returns of a 100% all-stock portfolio, you had to tolerate about twice as much volatility as you would have with 50%/50% stock/bond portfolio (16.72% vs. 8.35%). BUT, cutting the volatility in half also yielded only about half the returns (3.55% vs. 6.15%).
What mix is right for you? That’s something for you and your advisor to determine. But we hope the information will help you more stoically face the volatility we’re currently experiencing; it’s essentially part of the deal.
Read Quarterly Market Review Q1 2018
-
STDEV (standard deviation) is a measure of the variation or dispersion of a set of data points. Standard deviations are often used to quantify the historical return volatility of a security or portfolio. Diversification does not eliminate the risk of market loss. Past performance is not a guarantee of future results. Indices are not available for direct investment. Index performance does not reflect expenses associated with the management of an actual portfolio. Asset allocations and the hypothetical index portfolio returns are for illustrative purposes only and do not represent actual performance. Global Stocks represented by MSCI All Country World Index (gross div.) and Treasury Bills represented by US One-Month Treasury Bills. Globally diversified allocations rebalanced monthly, no withdrawals. Data © MSCI 2018, all rights reserved. Treasury bills © Stocks, Bonds, Bills, and Inflation Yearbook™, Ibbotson Associates, Chicago (annually updated work by Roger G. Ibbotson and Rex A. Sinquefield).
 Secure Document Sharing


